Interactive Visual Data Analysis (Recent Developments in Computer Science)
Course Description
The goal of this course is to explore recent advances in visualization research and applications, with an emphasis on sustainable development and didactics of visualization. Living in the information age, data visualizations are present in our personal and professional lives, from infographics in digital newspapers over pandemic dashboards to machine monitoring in a factory. The field of data visualization is dedicated to computational, visual, and interactive methods that help people perceive and reason about patterns in large and complex data. In this way, it helps address analysis questions in a variety of application areas like engineering or life sciences. Data visualization as a craft is nourished by many disciplines and skills including cognition, statistics, creativity, scientific rigor, analytical and critical thinking. Through hands-on projects and lecture sessions, we will dive deeper into some of these interesting facets. The course will be held in English.
Prerequisites
There are no enforced prerequisites for this course. However, a general interest in data visualization increases your chances of having fun in this course. Prior courses around visualization, visual computing, or interaction are very helpful but not required.
Learning Outcome
Students will gain an overview of fundamental principles of data visualization. They will get in touch with the appropriateness of visualizations and might thus view some of the data visualizations they encounter in their everyday life in a different light. Through projects and lecture contents, they will learn how visual analysis can be used to gain insights from large data, providing them with practical experience in approaching data-related questions with visualizations, for example in their future careers. At the end of this course, students will be able to
- identify and describe fundamental concepts of data visualization and different types of contributions to visualization research.
- critically judge a visualization’s appropriateness with respect to data, users, and tasks.
- understand a given research problem and implement a concept or technique to address it.
- present their work to an academic audience and discuss their contributions.
- organize, formulate, and reflect on their working method in a self-directed manner.
Course Mechanics
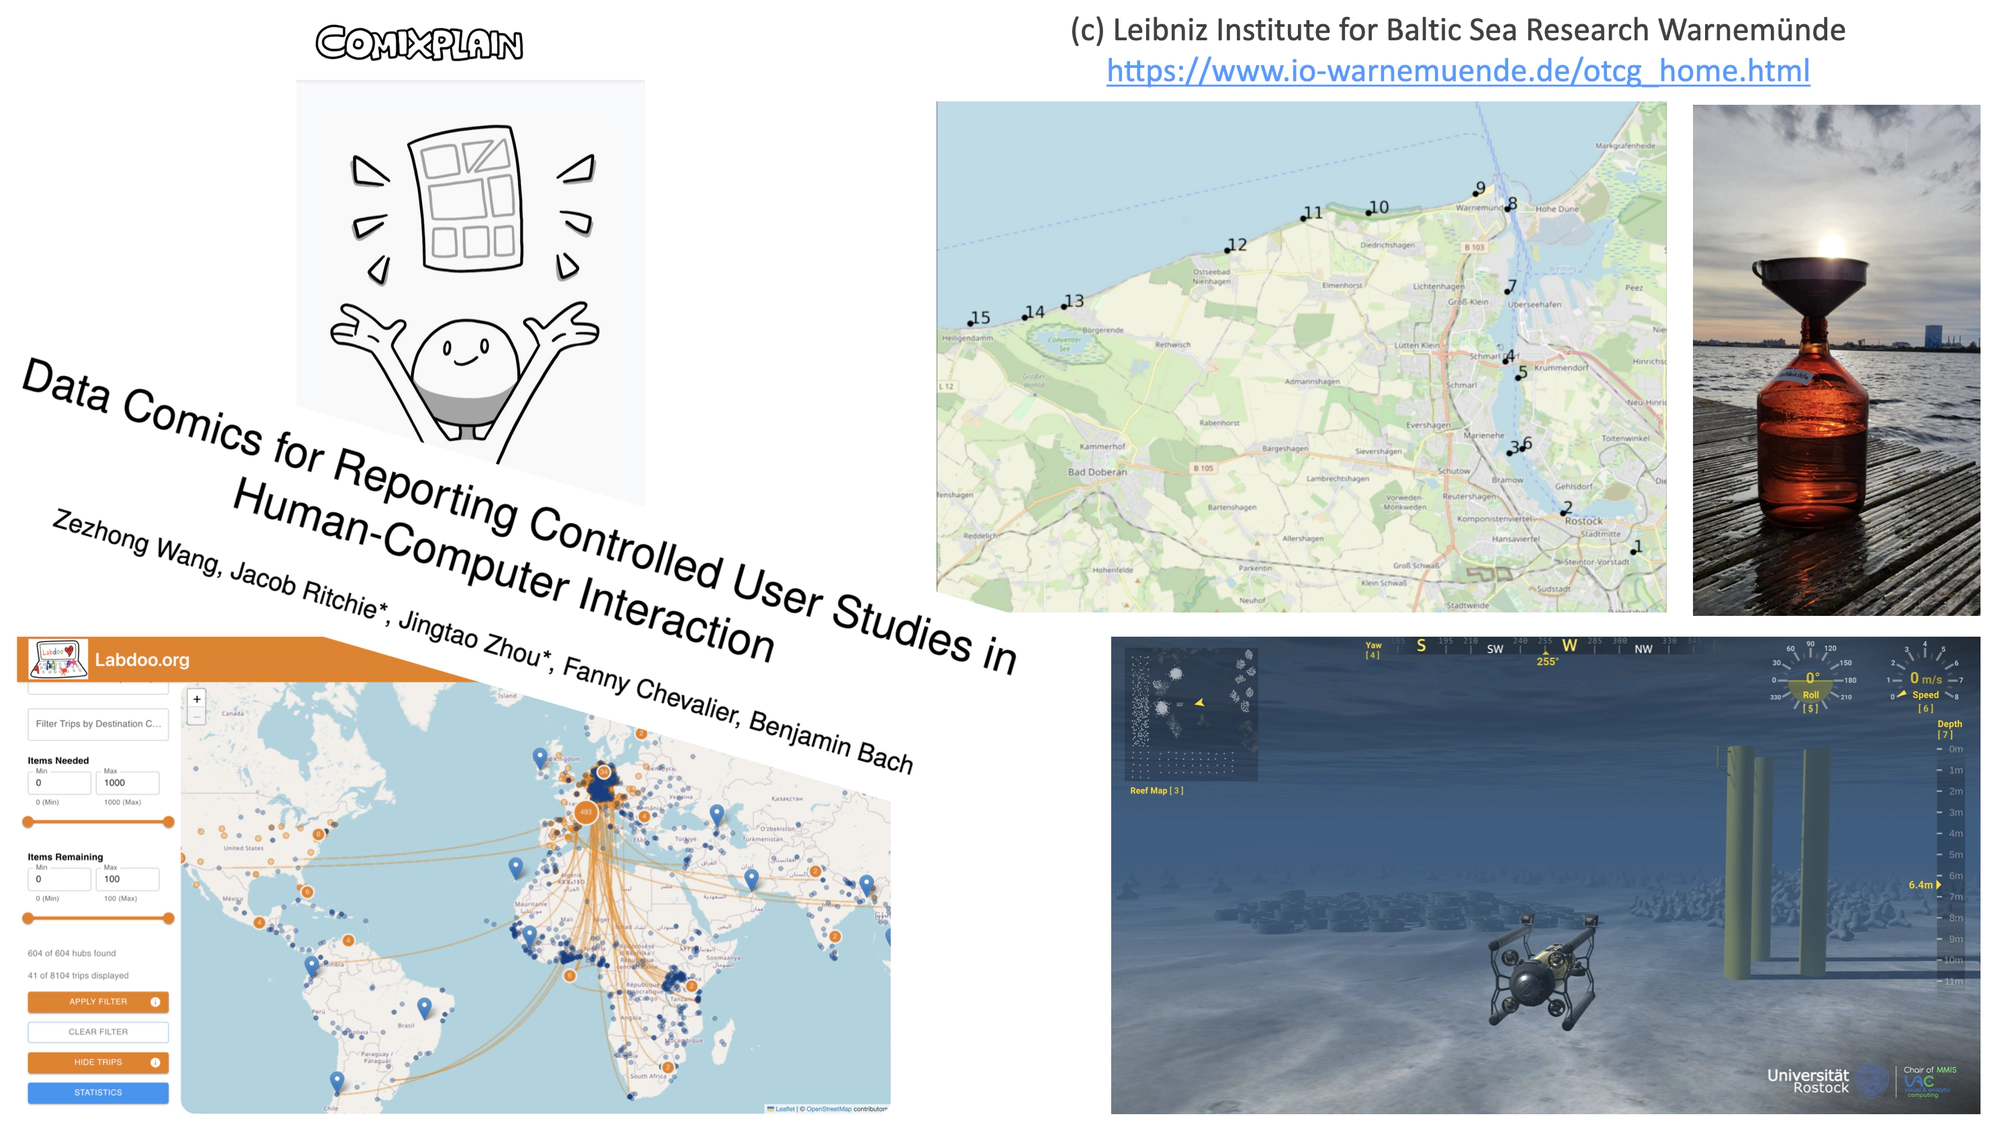
The course centers around projects that can be worked on alone or in pairs. Each project will be of one of two types: programming projects focus on the technical implementation of an interactive visual analysis tool, while concept projects focus on the design and realization plan of a visual artefact. Depending on the project type, the design, implementation, and evaluation stages are emphasized differently. In either case, the students will be responsible for characterizing the problem at hand, surveying existing approaches, developing alternative solutions, and reflecting on the results. Available project topics involve visualizing data related to, e.g., the Baltic Sea, the Earth Overshoot Day, or device donation trajectories. The project work will be spiced up with inspirational lecture sessions on hot topics in visualization research. There will be a project proposal, an intermediate presentation, and a final presentation of the results in a public poster session. Each student will further submit a project report.
Assessment Procedure
To pass the course (not graded), at least 70% need to be achieved. Up to 20% can be achieved by actively participating in the lectures. Up to 80% can be achieved by completing the project work (10% for project proposal, 20% for project deliverables, 10% for intermediate presentation and discussions, 20% for final (poster) presentation and discussions, 20% for project report). Students are expected to attend - and actively participate in - every lecture and presentation session. If they must miss a class for any reason, they are expected to email me in advance.